Interactive web application that uses logistic regression to sort any Spotify user’s Liked library into playlists.
Flask / Plotly-Dash web application is live on AWS and available here:
http://contextify.us-east-1.elasticbeanstalk.com/


Motivation
As a frequent Spotify user, I have a problem. Any time I come across a new song I like, I save it to my Library, which ends up being a mess of thousands of uncategorized songs. Because I never have time to organize them into playlists, I opt for other playlists available on Spotify when I’m listening to music for specific activities, like studying or working out. So, I am building contextify, which uses a logistic regression model to “learn” how songs typically get assigned to playlists by other Spotify users. I’ll then apply this model to my own library to automatically sort my music into playlists, allowing me to listen to more of my own music.
How it Works
For this project, I’ve created an automated, end-to-end pipeline to extract training / testing data from music database APIs, analyze and transform the data, then feed it into a logistic regression model so it can be used on my own song data. These steps are outlined broadly below. All application code is also listed on my contextify GitHub repo page.
1 - Extract, Transform, Load
- Input desired playlist names for sorting (ex: workout, hip-hop, edm, etc.). These will be class labels later on.
- For each playlist name, search Spotify’s playlist database using playlist names and return all tracks within the playlists returned. Label each track with the query that returned it.
- For each track, get track features from Spotify’s track feature API, then use the track name to query Deezer’s API for the track genre.
- Save labeled feature data to data store.
2 - Analysis and Visualization
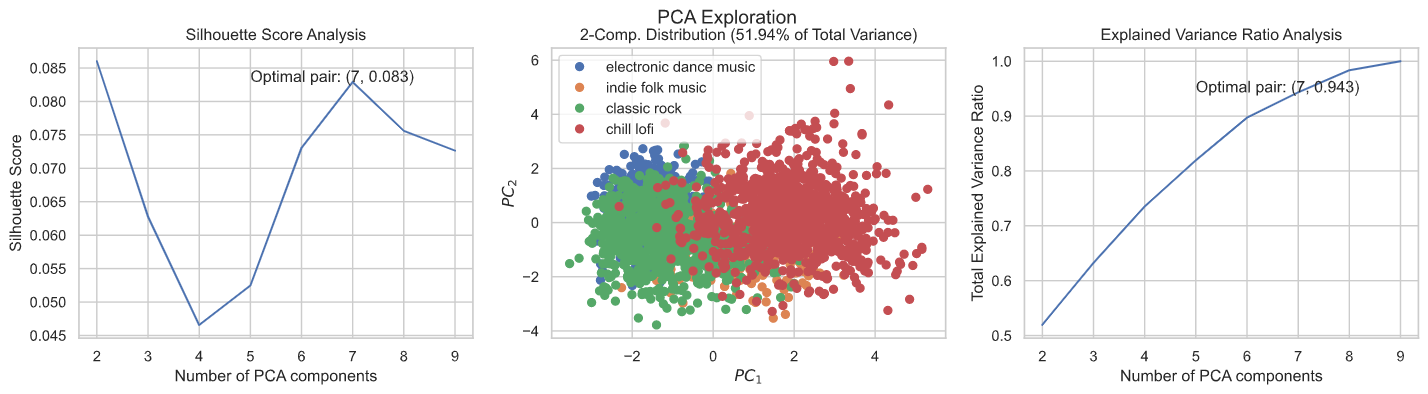
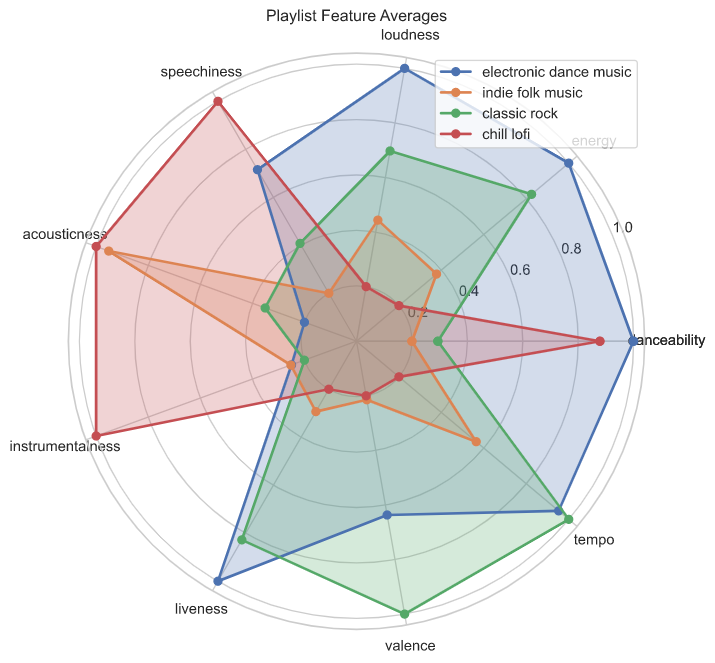
- Slice the data into different visualizations to understand playlist feature averages and distributions, relative class sizes, class overlap and degrees of feature collinearity.
- Present visualizations to the user. One key question to answer is how similar the feature distributions are between playlists, as this is an important predictor of model performance later on.
3 - Modeling
- Binarize categorical features and labels, then fit logistic regression model.
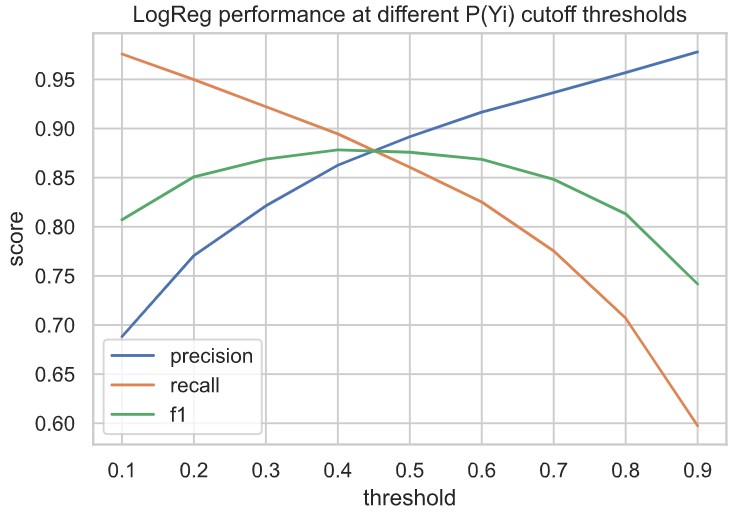
- Evaluate out-of-the-box logistic regression performance (precision, recall, f1) on different cutoff values n for P(Yi). In other words, given probability P(Yi) that a track belongs to playlist p, evaluate LogReg performance if assignment of track to playlist p is made for probabilities above cutoff value n.
- Select optimal n. Here, I am more concerned with the True Positive rate than the True Negative Rate (I’d rather have a smaller, high quality playlist than a larger playlist with more incorrect entries). So, I am weighting precision’s importance over recall.
- Tune LogReg model hyperparameters using GridSearchCV and validate on testing dataset.
- Test model on my own Spotify library dataset. Generate predicted classes and evaluate by computing average distance within each class to the centroid within the original training dataset, then comparing to the average distance within the training set.
4 - Web Application
- Wrap data ingest, visualization, and modeling workflow in Plotly-dash module and serve in a Flask application.
- Enable Spotify OAuth authentication to allow users to pass in their song data for analysis and classification.
- Deploy completed web application on AWS using Elastic Beanstalk.
Spotify API Documentation: https://developer.spotify.com/documentation/web-api/
Deezer API Documentation: https://developers.deezer.com/api